Telegraf is a plugin-driven server agent for collecting and reporting metrics for all kinds of data from databases, systems, and IoT devices
Install
- Download InfluxDB and Telegaf from https://portal.influxdata.com/downloads/
Downloads

Install and Create InfluxDB
InfluxDB
Install and setup InfluxDB

Config and Run Telegaf
Add/Replace config file telegraf.cof to match with above InfluxDB Database and InfluxDB endpoint / port
Run CLI test
telegraf.exe --config "<absolute path to telegraf.conf>" --test
- If the test fine, then stop and let install telegaf as service
telegraf.exe --config "<absolute path to telegraf.conf>" --service install
- Then start the service
net start telegraf
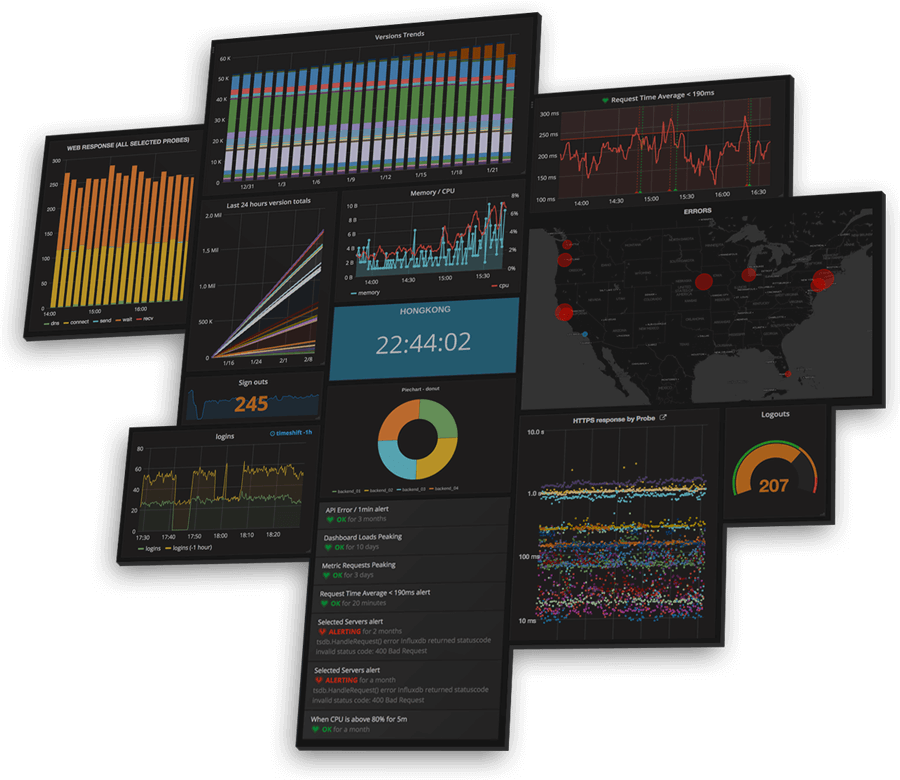
Visualize by Grafana
Add InfluxDB as Database in Grafana
- Database name: telegraf
- Username: grafana
- Password: grafana123
Import Dashboard by this Json or import 1 of Dashboard from Grafana
Grafana Dashboards - discover and share dashboards for Grafana.
Grafana.com provides a central repository where the community can come together to discover and share dashboards.


